

An earlier post reiterated my reasons for doubting that the social sciences can in principle give rise to general theories that serve to organize and predict the domain of social phenomena. The causes of social events are too heterogeneous and conjunctural to permit this kind of systematic representation.
That said, social behavior and social processes give rise to very interesting patterns at the macro scale. And it is always legitimate to ask what the causes are that produce these patterns. Consider the following graphs. They are drawn very miscellaneously from a range of social science disciplines.


The graph representing the evolution of China's agricultural economy tells an interesting and complicated story. It shows rising productivity in agriculture and (since 1984) a sharp decline in the proportion of the labor force involved in agriculture -- an important cause of China's urban growth and the growth of its internal migrant population. And it shows a long-term decline in the share of the national economy played by agricultural production overall, from about 40% in 1969 to less than 15% in 2005. What these statistics convey is a period of fundamental change in China, in economy, urbanization, and ultimately in politics.
The graph of the composition of the US population is a time series graph that tells a complicated story as well -- a smooth rise in total national population composed of shifting shares of population across the regions of the country. These shifts of population shares across the region's of the country demand historical and causal explanation.
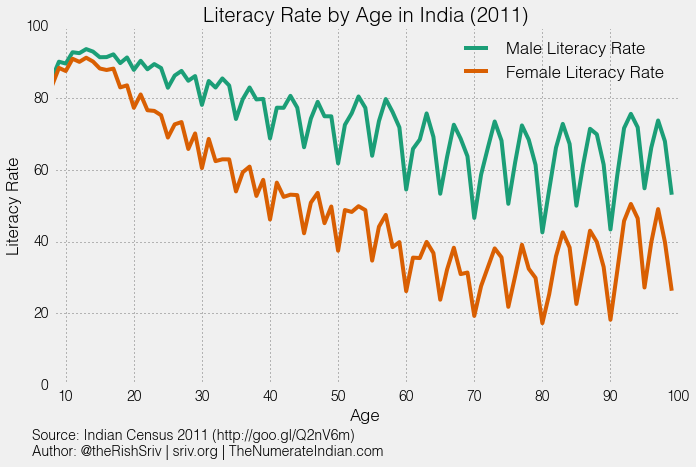
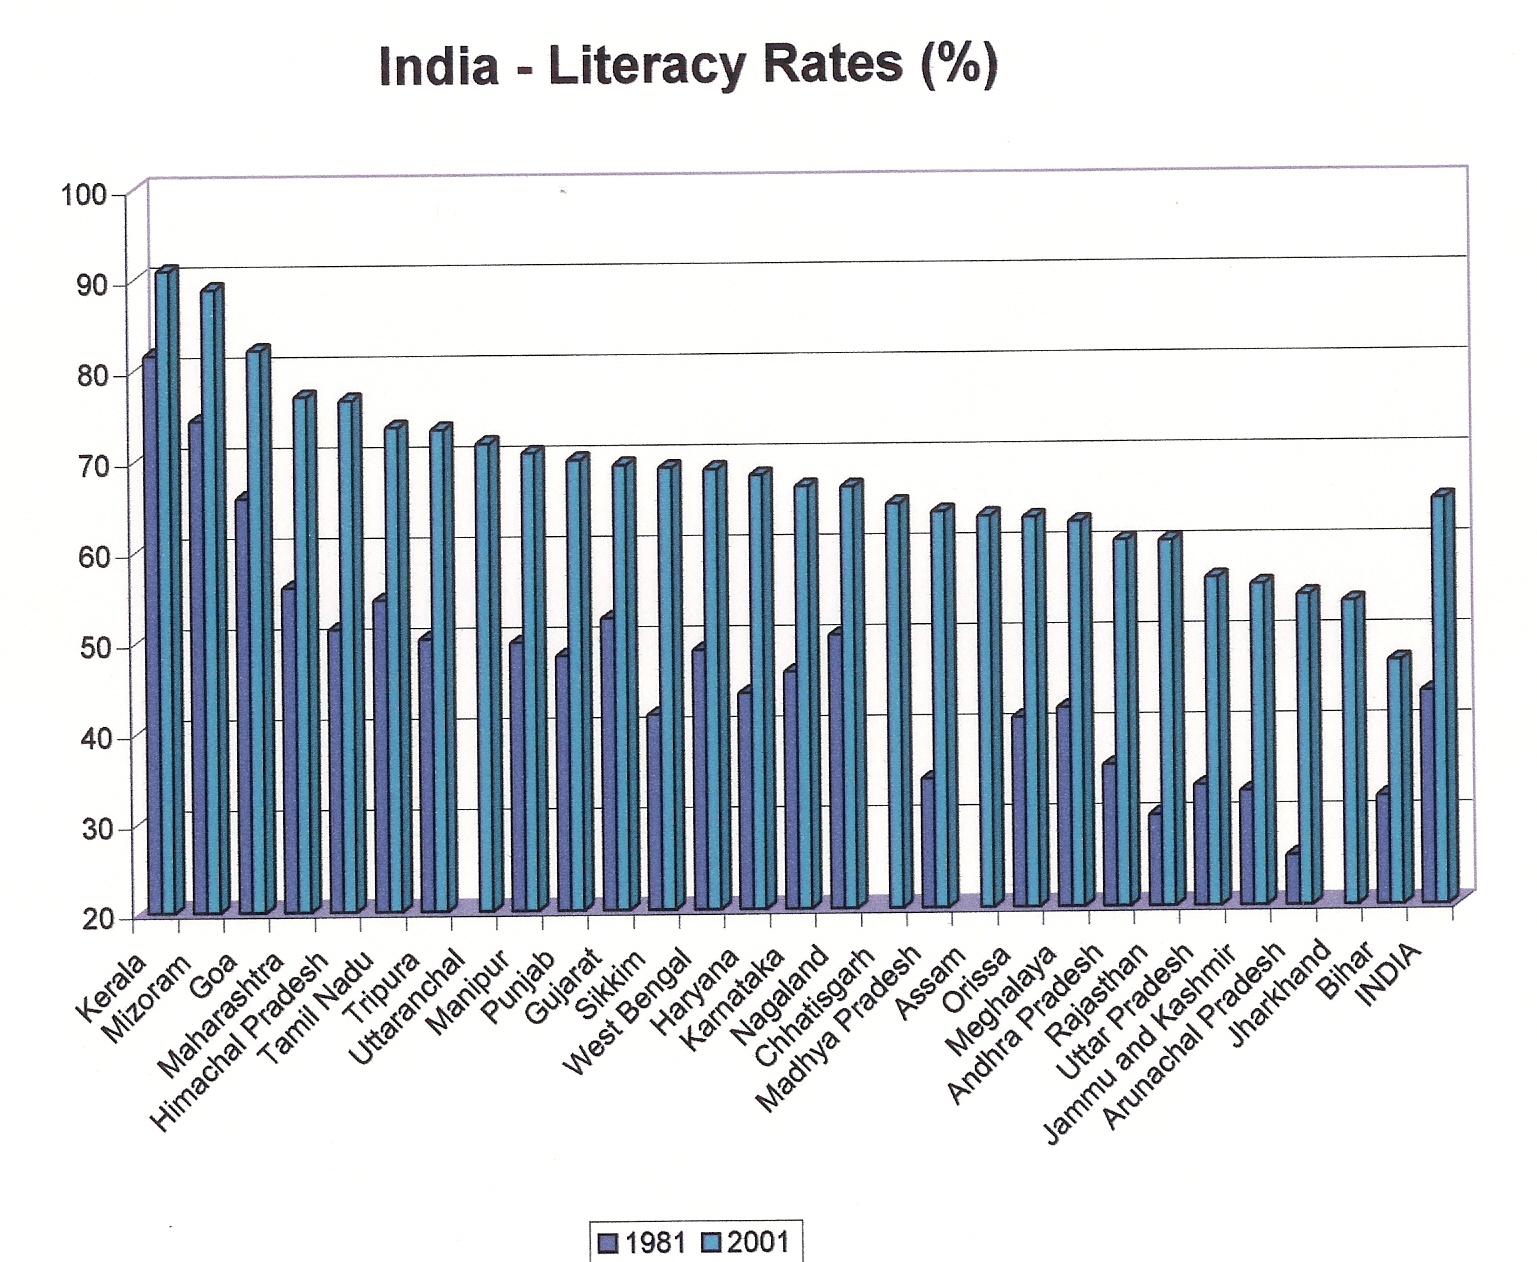
The graph of India's literacy rates over age warrants comment. It appears to give a valid indication of several important social realities -- a persistent gap between men and women of all ages, and lower literacy among older men and women. But the graph also displays variation that can only reflect some sort of artifact from the data collection: literacy rates plummet at the decade and half decade, for both men and women. Plainly there is a problem with the data represented in this graph; nothing could explain a 15% discrepancy in literacy rates between 57-year-old men and 60-year-old men. The same anomalous pattern is evident in the female graph as well. Essentially there are two distinct data series represented here: the decade and half-decade series (low) and the by-year series (high). There is no way of telling from the graph which series should be given greater credibility. The other chart representing state literacy rates is of interest as well. It allows us to see that there are substantial gaps across states in terms of literacy -- Kerala's literacy rate in 1981 is 2.5 times higher than that of Bihar in that year. And some states have made striking progress in literacy between 1981 and 2001 (Arunachal Pradhesh) while other states have shown less proportional increases (Kerala). Here though we can ask whether the order of states on the graph makes sense. The states are ranked from high to low literacy rates. Perhaps it would be more illuminating to group states by regions so it is possible to draw some inferences and comparisons about similarly situated states.
The graph representing grain price correlations across commodities in Qing China demands a different kind of explanation. We need to be able to identify a mechanism that causes prices in different places to converge to a common market price separated by the cost of transport between these places and the relative utilities of wheat, sorghum, and millet. The mechanism is that of mobile price-sensitive traders responding to information about prices in different locations. The map demonstrates the existence of these mechanisms of communication and transportation on the ground. This is a paradigm example of a mechanism-based explanation. (This example comes from Rawski and Li, eds., Chinese History in Economic Perspective (Studies on China).)
The graph representing the rank order of city sizes is perhaps the most intriguing among all of these. There is nothing inherently implausible about a population distributed across five cities of comparable size and a hundred towns of comparable size -- and yet this hypothetical case would display a size distribution radically different from the Zipf law. So what explanation is available to account for the empirical pattern almost universally observed? Various scholars have argued that the regularity is the result of very simple conditions that apply to city growth rates over time, and that the cities in a growing population will come to conform to the Zipf regularity over time as a simple statistical consequence of size and growth (link). It is an example, perhaps, of what Schelling calls "the inescapable mathematics of musical chairs" (Micromotives and Macrobehavior).
What these examples have in common is that they illustrate two of the key tasks of the social sciences: to measure important social variables over time and space, and to identify the social mechanisms that lead to variation in these variables. There are large problems of methodology and conceptual clarification that need to be addressed in both parts of this agenda. On the side of measurement, we have the problems of arriving at consistent and revealing definitions of economic wellbeing, using incomplete historical sources to reconstruct estimates of prices and wages, and using a range of statistical methods to validate and interpret the results. And on the explanatory side, we are faced with the difficult task of reconstructing social processes and forces in the past that may have powered the changes we are able to document, and with the task of validating the hypotheses we have put forward on the basis of historical evidence.
No comments:
Post a Comment